-
A
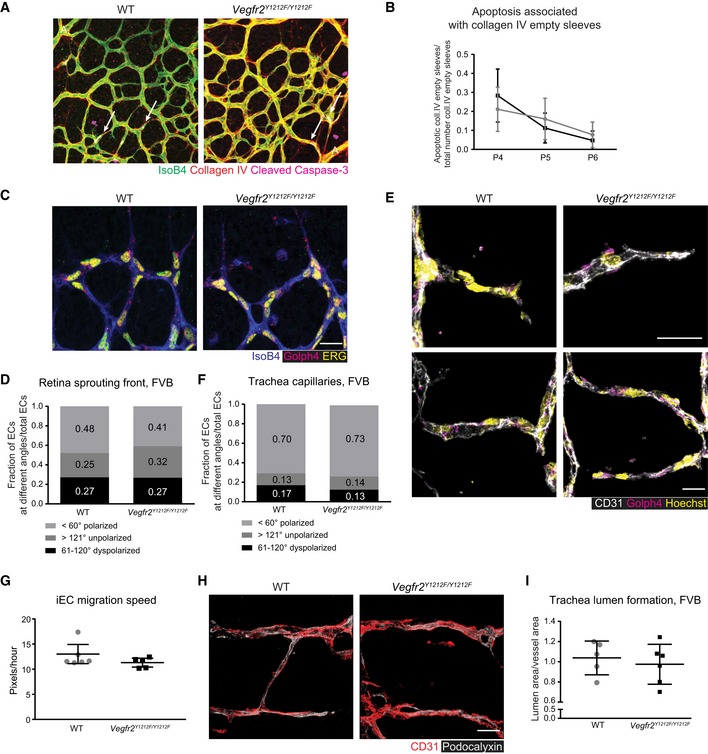
Apoptosis in the developing retina. Immunostaining for isolectin B4 (IsoB4, green), collagen IV (red), and cleaved caspase‐3 (pink) in FVB P5 retinas. Arrows, cleaved caspase 3‐positive ECs. A, artery. Scale bar, 50 μm.
-
B
Quantification of cleaved caspase‐3‐positive ECs adjacent to collagen IV empty sleeves, normalized to the total number of collagen IV empty sleeves/field/mouse. Error bars: SD; 2‐way ANOVA not significant. P4 n = 6–9 retinas, one retina/mouse, P5 n = 7–12, P6 n = 3–5.
-
C, D
EC polarity in the FVB P5 retina. (C) The angle between the position of the Golgi and the center of the nucleus was determined on retinas immunostained for isolectin B4 (IsoB4, white), ERG (yellow), and Golph4 (magenta). Cells were scored as polarized in the direction of vascular development, i.e., with an angle < 60°, dyspolarized (61–120° angle), or unpolarized (angle > 121°). Scoring was normalized to the total number of ERG‐positive ECs. (D) Bar graph shows the ratio of cells scored in the different ranges, < 60°, 61–120°, > 121°. Scale bar, 10 μm; 2‐way ANOVA not significant. n = 80–130 cells/retina.
-
E, F
EC polarity in FVB P3 tracheal capillaries. (E) Immunostaining for CD31 (white), nuclei (Hoechst), and Golph4 (magenta). (F) Assessment of Golgi orientation in relation to the nucleus as for (C, D). Number of cells within a certain angle group is normalized to the total number of ECs for each capillary. Scale bar, 10 μm; 2‐way ANOVA not significant. n = 12–33 cells/trachea.
-
G
Isolated EC (iEC) migration speed in wound healing assay. Quantification of cell migration speed toward the wound of ECs isolated from wild‐type (WT) and Vegfr2
Y1212F/Y1212F FVB lungs. Each bar represents the mean and standard deviation of the migration speed of each iEC per mouse. Error bars: SD; unpaired t‐test, not significant. n = 70–90 cells/2 wells per mouse/5–6 mice/2 experiments.
-
H, I
Lumen formation in FVB P3 tracheal capillaries. (H) Immunostaining for CD31 (red) and podocalyxin (white), in an ImageJ‐3D picture reconstruction of trachea capillaries. (I) Quantification of lumen area as podocalyxin‐positive area normalized to CD31‐positive vessel area. Scale bar, 50 μm; each dot represents the mean of five capillaries/trachea/mouse; error bars: SD; unpaired t‐test, not significant. n = 5–6.

