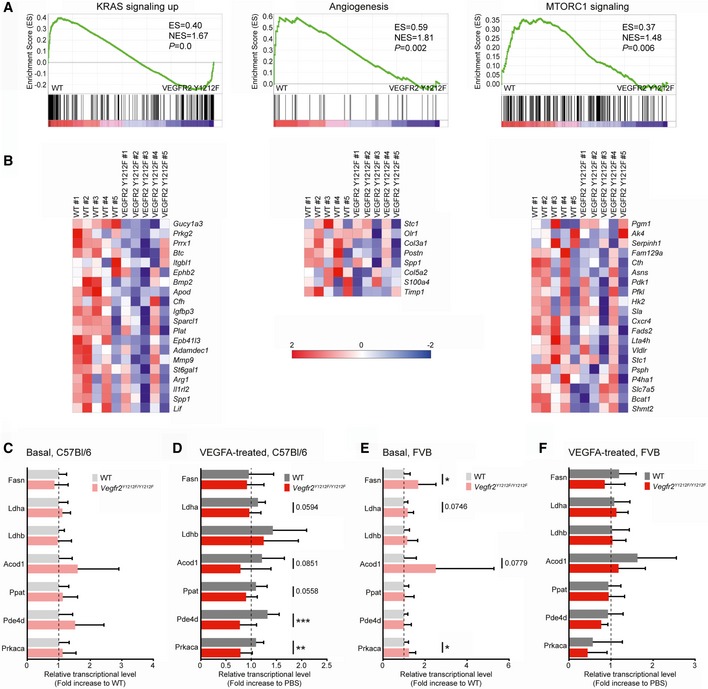
Figure 5. Myc gene transcription and transcriptional activity regulation by VEGFR2 Y1212 signaling.

-
AGSEAs showing upregulation of genes belonging to the K‐Ras, angiogenesis, and mTORC1 gene sets in wild‐type (WT) compared to VEGFR2 Y1212F isolated ECs. K‐Ras and angiogenesis gene sets derived from C57Bl/6 iECs kept in basal condition; mTORC1 gene set derived from C57Bl/6 iECs treated with VEGFA for 3 h. See Table 2. Enrichment score (ES) and normalized ES (NES) are shown. P‐values < 0.05 were regarded as significant.
-
BHeat maps displaying gene regulation in gene sets shown in (A). The color in the heatmap shows the gene expression value, expressed as a z‐score across animals. Red color represents relative higher expression, and blue color represents relative lower expression value. The z‐score is calculated by (x–x’)/s where x is individual gene expression, x’ is the mean of the gene expression across samples, and s is standard deviation of the gene expression across samples.
-
C–FMyc‐regulated gene expression downstream of VEGFR2 pY1212. Quantitative PCR analysis of a set of known Myc‐regulated transcripts in C57Bl/6 (C, D) and FVB (E, F) adult lungs at basal (C, E) and at 1 h after tail‐vein administration of VEGFA (D, F). FASN, fatty acid synthase; Ldha and Ldhb, lactate dehydrogenase A and B; Acod1, aconitate decarboxylase 1; Ppat, amidophosphoribosyltransferase; Pde4d, cAMP‐specific 3′,5′‐cyclic phosphodiesterase 4D; Prkaca, cAMP‐dependent protein kinase catalytic subunit alpha. Error bars: SD; 2‐way ANOVA between WT and Vegfr2 Y1212F/Y1212F P = 0.0453 (C), P < 0.0001 (D), P = 0.0018 (E), P = 0.09 (F); unpaired t‐test, *P < 0.05, **P < 0.01, ***P < 0.001. C57Bl/6 n = 8–11 mice, FVB n = 9–14 mice.
