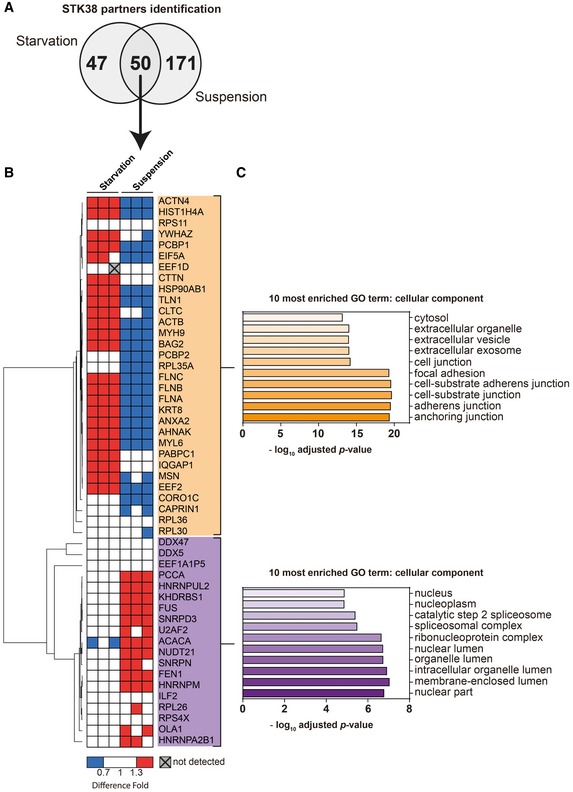
Figure 1. STK38 associates with cytoplasmic interactors upon nutrient starvation and with nuclear interactors upon suspension growth.

- Venn diagram of STK38 partners identified in both starvation and suspension conditions by proximity biotinylation assay coupled to mass spectrometry identification (see Appendix Table S1 for the complete list of STK38 context‐dependent interactors and Fig EV1 for the context‐dependent protein labeling strategy).
- Heatmap representation of common STK38 interactors identified in both starvation and suspension conditions according to their dynamic of association with STK38 (with a minimal fold increase of 1.38 ± 0.06). Unsupervised hierarchical clustering was generated based on their association fold using Pearson correlation.
- Representation of the 10 most cellular component enriched terms of the two clusters (assessed by using the Gene Ontology (GO) database; http://www.geneontology.org/).
