
Figure EV3. CRISPR/Cas9 knock‐in HAP1 cell lines and representative images of LC3 dots (related to Fig 5).
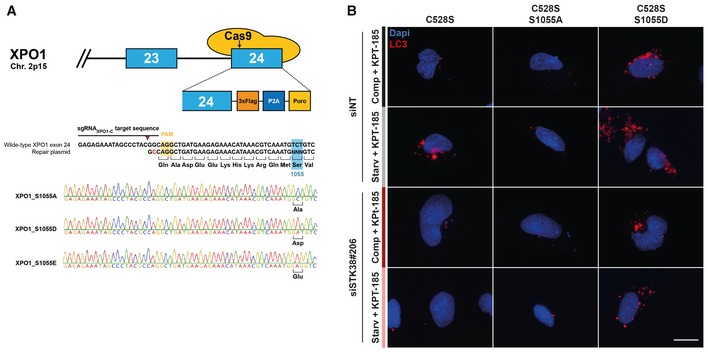
- Schematic overview of CRISPR/Cas9 genome editing of XPO1 in HAP1 cell lines. Exons are shown as blue boxes and introns are visualized as a thick black line, while Cas9 is represented by the yellow oval shapes. The DNA sequence and corresponding amino acid of the region around the Ser1055 residue are enlarged. The Cas9 PAM sequence is indicated in yellow, the sgRNA sequence is highlighted by a black line above the DNA sequence, and the Cas9 cutting site is indicated by the brown arrowhead. The wild‐type sequence is shown together with the sequence of the donor repair plasmid used to generate the S1055 mutations, and the additional silent mutation to prevent recutting of the mutagenized gene is marked in red. Sanger sequencing chromatograms of the generated XPO1 S1055 mutant cell lines are shown with the desired mutations highlighted in bold.
- HEK‐HT‐iRFP‐LC3 cells were transiently transfected with siRNA targeting endogenous STK38 (or with non‐targeting siRNA (siNT)). After 2 days, cells were transiently transfected with the indicated Flag‐XPO1 mutant plasmids. Twenty‐four hours later, cells were incubated with DMEM or EBSS for 4 h, both supplemented with KPT‐185 (final concentration = 1 μM) in order to inhibit endogenous XPO1 activity and with chloroquine (final concentration = 10 μM). Cells were then fixed, and the number of iRFP‐LC3 dots per cell was recorded only in cells positive for Flag‐XPO1 mutants. Representative images are shown, and scale bars are 20 μm.