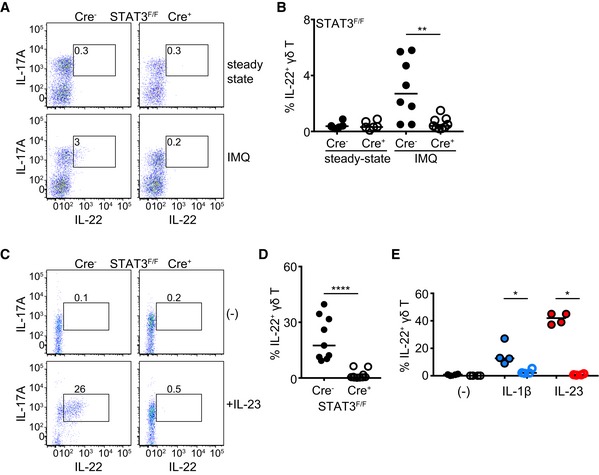
Flow cytometric analysis of lymph node γδ T cells in RORγt
CRE‐STAT3
F/F (Cre
+) and littermate control mice (Cre
−). In graphs, each symbol represents a mouse or experiment and line the median. *
P < 0.05, **
P < 0.01, ****
P < 0.0001 using Mann–Whitney test.
-
A, B
Representative dot plots showing IL‐22 and IL‐17A production in γδ T cells (A) and frequency of IL‐22+ γδ T cells (B) before (steady state) and after IMQ‐induced psoriasis. Steady state: n = 6; 3 experiments, IMQ: n = 8–9; 3 experiments.
-
C, D
Representative dot plots showing IL‐22 and IL‐17A production in γδ T cells (C) and frequency of IL‐22+ γδ T cells (D) following culture without (−) or with 40 ng/ml recombinant IL‐23 (n = 9–10, 3 experiments).
-
E
Frequency of IL‐22+ γδ T cells following culture with IL‐1β, IL‐23, or nothing. Each symbol represents one experiment. Open circles = Cre+ (each color represents a different culture condition).

