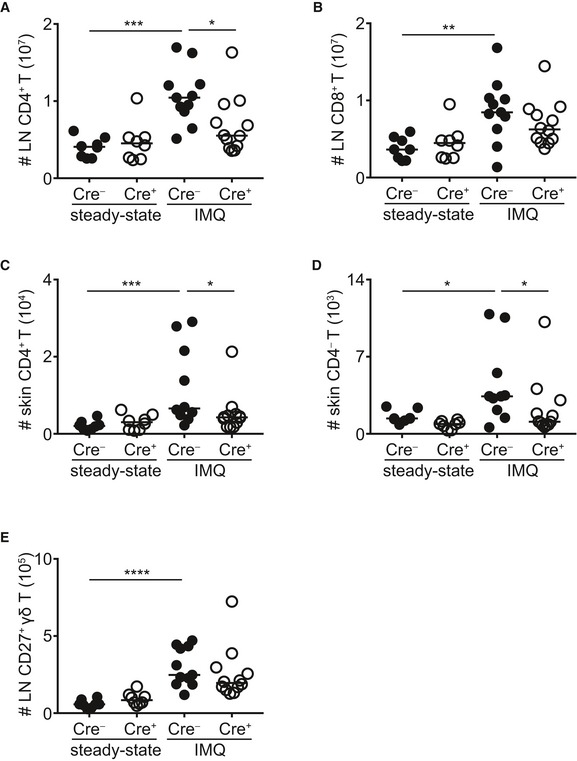
Flow cytometric analysis of lymph node or skin lymphocytes in RORγt
CRE‐STAT3
F/F (Cre
+) and littermate control mice (Cre
−). In graphs, each symbol represents a mouse and line the median. *
P < 0.05, **
P < 0.01, ***
P < 0.001, ****
P < 0.0001 using Mann–Whitney test.
-
A, B
Numbers of LN CD4+ and CD8+ T cells before (steady state) and after IMQ treatment.
-
C, D
Numbers of skin CD4+ and CD4− T cells before (steady state) and after IMQ treatment.
-
E
Numbers of LN CD27+ γδ T cells before (steady state) and after IMQ treatment.
Data information: Steady state:
n = 8; 4 experiments, IMQ:
n = 11–12; 4 experiments.

