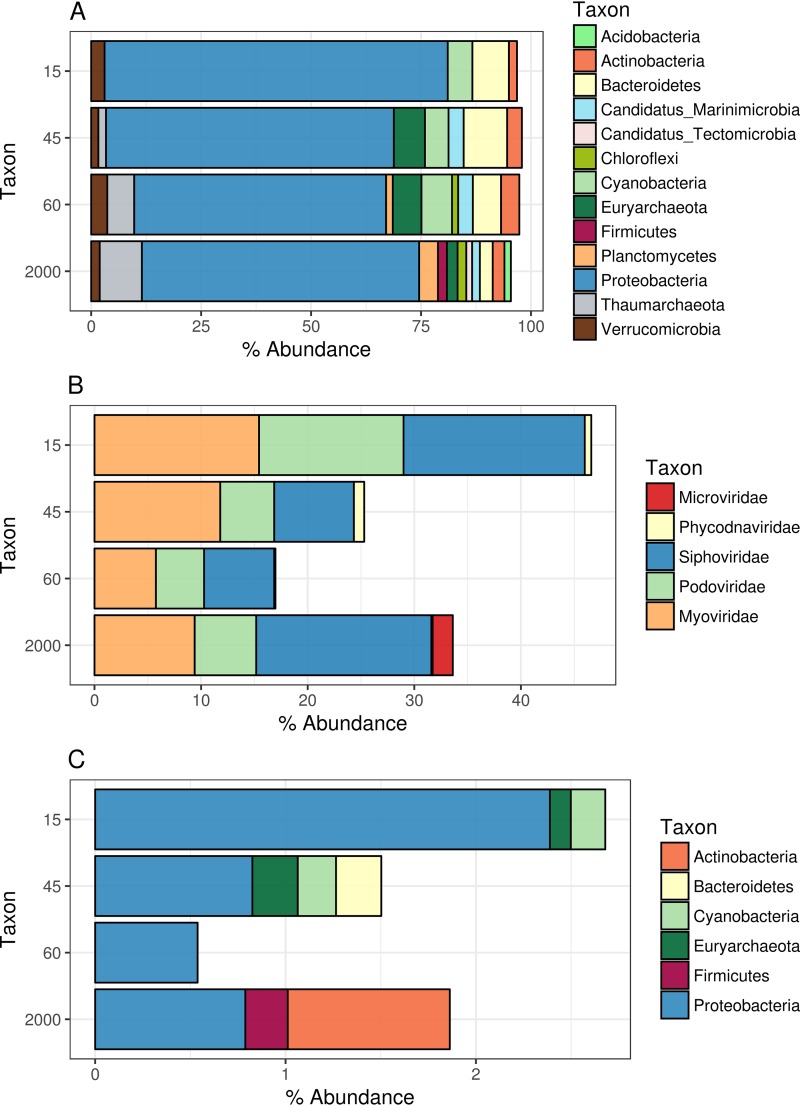
FIG 2.
Prokaryote and viral community composition profiles across the depth gradient. Bar plots depict the relative abundances of prokaryote taxa or viruses. Only groups that displayed relative abundances equal to or above 0.1% are shown. (A) Prokaryote taxon abundances were calculated by querying reads from the cellular metagenomes against sequences in the NCBI nr database. (B) Viral abundances were calculated by querying reads against the database of assembled viral scaffolds and summing the percentages of reads mapped to the taxonomic classification of the scaffolds. (C) Same as for panel B but with viral abundances summed according to the putative host phylum of the scaffolds.

