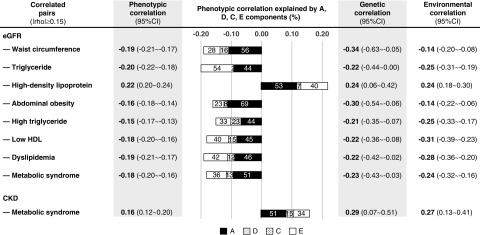
Figure 2.
Bivariate decomposition analyses. Phenotypic correlations between traits of metabolic syndrome and CKD are partitioned to their genetic and environmental components. The phenotypic correlation coefficient between each pair is presented by the whole length of each bar, and the proportions of phenotypic correlation explained by different components are presented by the length of different bars. The maximum likelihood methods were used to estimate the proportion of A (additive genetic effects, indicated in black), D (dominant genetic effects, indicated in gray) or C (shared environmental effects, indicated in black dots), E (unique environmental effects, indicated in white), contributing to the correlation between two traits. Liability-threshold model was used for binary traits (CKD, metabolic syndrome, abdominal obesity, high triglyceride, low HDL, dyslipidemia). The AIC was used to compare the goodness of fitting of ACE (a model including A, C, and E components), ADE (including A, D, and E components), and AE (including A and E components) models, and the most parsimonious one was defined by the lowest AIC value. Significant estimates are in bold (P value <0.05).

