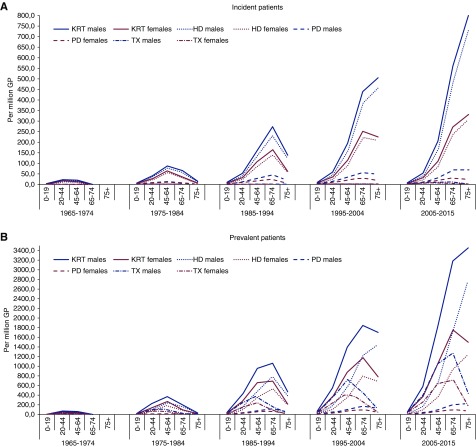
Figure 1.
Sex-specific time trends in kidney replacement therapy incidence and prevalence, per million population, by age group. (A) Incidence per million population for men (blue lines) and women (pink lines). (B) Prevalence per million population for men (blue lines) and women (pink lines). GP, general population; HD, hemodialysis; KRT, kidney replacement therapy; PD, peritoneal dialysis; TX, kidney transplantation.

