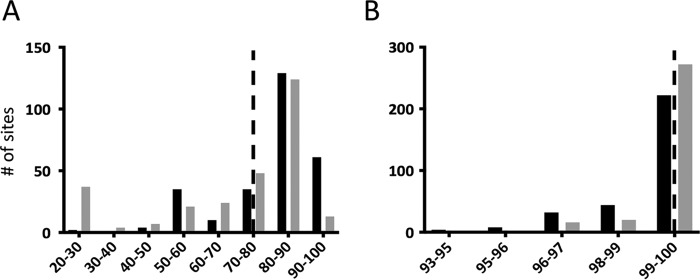
FIG 3.
Recombination margins in Chlamydia intraspecies and interspecies lateral gene transfer events. The percentages of identity at the collected margins of recombination for chlamydial interspecies (A) and intraspecies (B) events are indicated for the collected primary recombination events. Intraspecies data were collected from the recombinant strains described by Jeffrey et al. (5). In each graph, the x axis indicates the percent identity between the parental strains of the recombinant progeny, and the y axis depicts the number of recombination margins falling in the indicated range. The gray bars indicate the percent identity within the 100 bp surrounding a crossover site (50 per side), and the black bars indicate the percent identity within the 1,000 bp surrounding a crossover site. The dashed line in each graph indicates the overall percent genomic identity for parents in the specific crosses.

