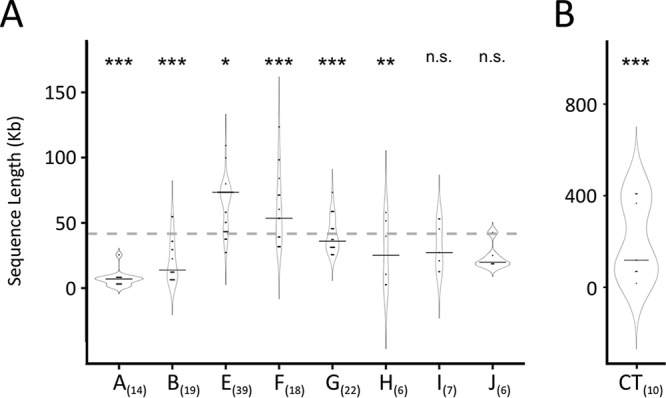
FIG 6.

Lengths of primary recombined fragments generated in C. muridarum × C. trachomatis crosses. (A) Recombinant fragment lengths are indicated on the vertical axis, and the groups from Fig. 2 are listed on the horizontal axis. Each region shown in Fig. 2 that is represented by at least 6 individual clones was included in these analyses. The number of clones examined in each region is indicated in parentheses. The overall mean from all primary C. muridarum inserts into the C. trachomatis genome is indicated as a dashed line, while group medians are shown with solid lines within the violin plots. (B) Parallel data from recombinant progeny generated in intraspecies (C. trachomatis × C. trachomatis) recombinant strains described in reference 5. Note the different scales on the vertical axes in panels A and B. The difference between the mean length for each region and the overall mean for all recombined inserts was analyzed using a Weibull distribution. *, P value of ∼0.05; **, P < 0.05; ***, P < 0.001; n.s., not significant.
