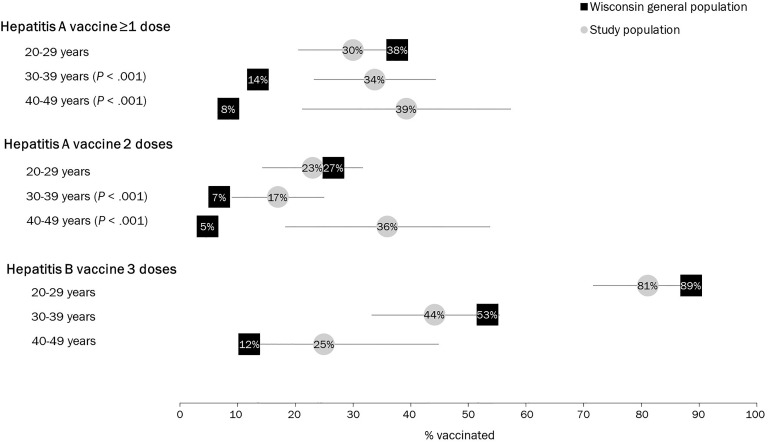
Figure 2.
Hepatitis A and hepatitis B vaccination coverage, by age group, among the study population (ie, persons who inject drugs who had positive hepatitis C antibody test results after testing at a syringe services program) and the general population, Wisconsin, 2018. Gray lines indicate 95% confidence intervals. P values indicate a significant difference between coverage among the study population and coverage among the Wisconsin general population using a 1-sample test of proportions. P < .05 was considered significant. Data source: Wisconsin Immunization Registry.24

