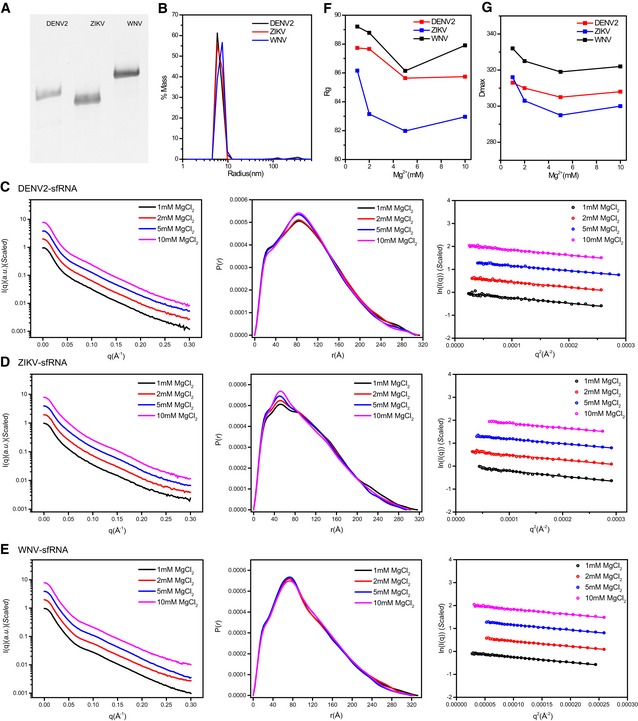
Figure EV1. sfRNA sample preparation and characterization.

-
ATris‐borate‐magnesium (TBM) polyacrylamide gel for sfRNAs of DENV2, ZIKV, and WNV, respectively.
-
BThe distribution of the light scattering by sfRNAs as a function of particle radius in solution.
-
C–EThe scattering curves (left), PDDFs (middle), and guinier plots (right) for sfRNAs of DENV2 (C), ZIKV (D), and WNV (E) at various Mg2+ concentrations.
-
F, GR g (F) and D max (G) of sfRNAs derived from guinier plots and PDDF calculation were plotted as a function of Mg2+ concentration.
