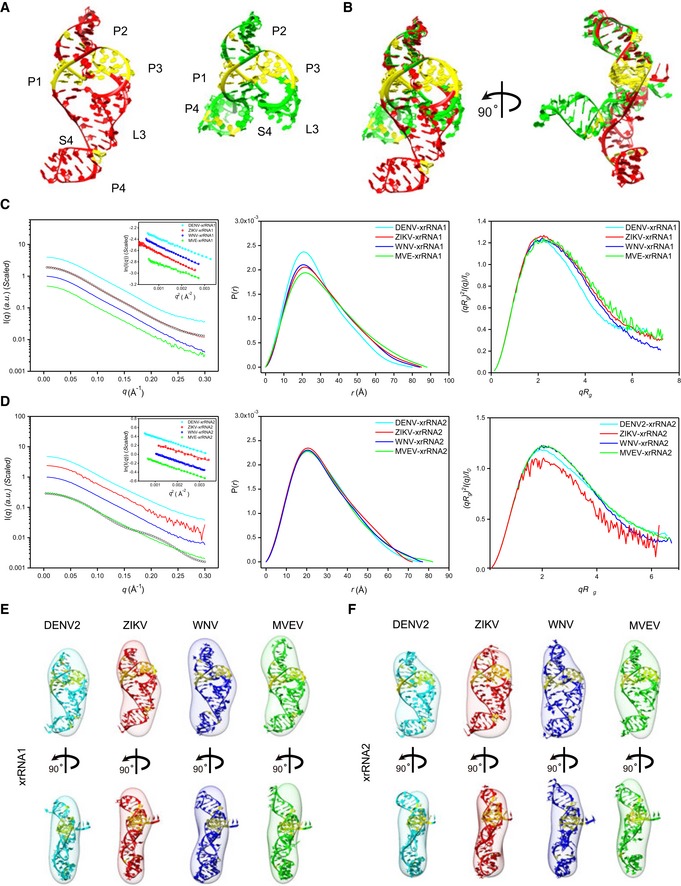
C, DThe scattering profiles (left), the PDDFs (middle), and the dimensionless Kratky plots (right) of individual xrRNA1s (C) and xrRNA2s (D) of DENV2 (cyan), ZIKV (red), WNV (blue), and MVEV (green). The insets in (C) and (D) show the Guinier regions of the respective scattering profiles with a linear fit line. The back‐calculated scattering profile of ZIKV‐xrRNA1 crystal structure (black, open circle) can be nicely fitted onto its experimental SAXS data (red line) in (C), while the back‐calculated scattering profile of MVEV‐xrRNA2 crystal structure (black, open circle) fits poorly to its experimental SAXS data (green line) in (D). The asymmetric PDDFs of xrRNA1 (C) and xrRNA2 (D) indicate slightly elongated molecules with asymmetric shapes. The dimensionless Kratky plots of xrRNA1 (C) and xrRNA2 (D) of DENV2, ZIKV, WNV, and MVEV suggest all individual xrRNA1s and xrRNA2s are well‐folded and of reduced flexibility in solution.

