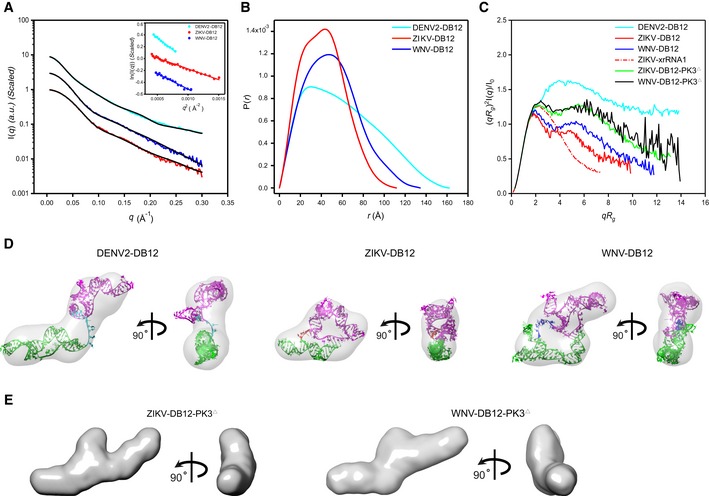
A–CThe scattering profiles (A), the PDDFs (B), and the dimensionless Kratky plots (C) of DB12s from DENV2 (cyan), ZIKV (red), and WNV (blue). The inset in (A) shows the Guinier regions of the respective scattering profiles with linear fit lines. The dimensionless Kratky plot of ZIKV xrRNA1 (red dashed line) was included in (C) for comparison, indicating that the structures of DB12s of ZIKV and WNV are well‐folded, but that of DB12 of DENV2 is partially folded. The Kratky plots for the two PK3 mutants of DB12s, the ZIKV‐DB12‐PK3Δ (green) and WNV DB12‐PK3Δ (black), respectively, are also included for comparison, suggesting reduced compactness upon PK3 mutations.