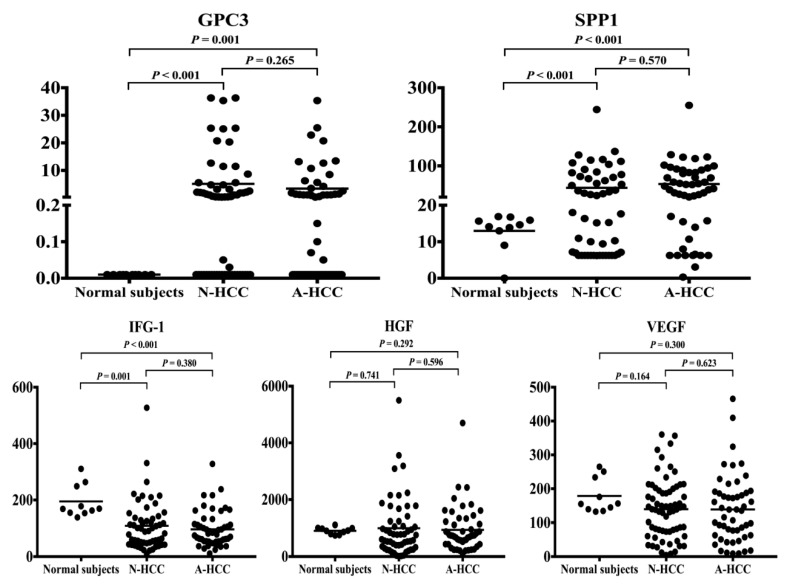
Figure 2.
The scatter dot plots of GPC3, SPP1, IGF1, HGF, and VEGF. The serum levels of novel markers for N-HCC, A-HCC, and healthy subjects were determined by ELISA and represented as scatter dot plots. The arithmetic means of the tested parameters are indicated by a line. Student’s t test was employed for the statistical analysis and P < 0.05 was considered significant. GPC3, glypican 3; SPP1, secreted phosphoprotein 1; IGF1, insulin-like growth factor 1; HGF, hepatocyte growth factor; VEGF, vascular endothelial growth factor. N-HCC, normal α-fetoprotein HCC; A-HCC, abnormal α-fetoprotein HCC; ELISA, enzyme-linked immunosorbent assay.

