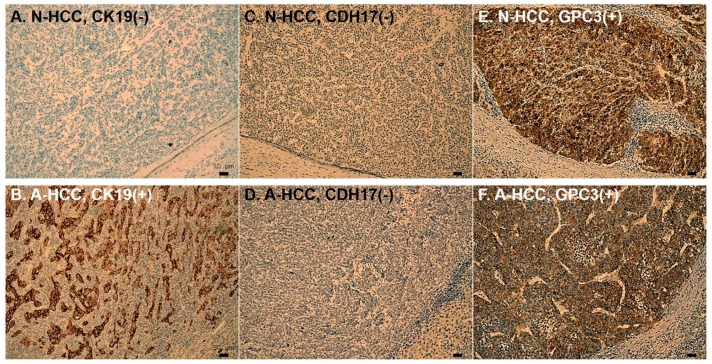
Figure 4.
Immunohistochemical (IHC) microphotograph of primary HCC. The upper row (A, C, E) is IHC of N-HCC, while the lower row (B, D, F) is that of A-HCC. Most N-HCC and A-HCC (E and F) would express GPC3, while the expressions CDH17 were both low in N-HCC and A-HCC (C and D). CK19 was sparsely seen in N-HCC. About one-fourth of A-HCC tumors had CK19 expression (B); however, only 5% of N-HCC tumors expressed CK19 (A) (P = 0.003). (Magnifications, × 100). N-HCC, normal α-fetoprotein HCC; A-HCC, abnormalα-fetoprotein HCC; GPC3, glypican 3; CDH17, cadherin 17; CK19, cytokeratin 19.

