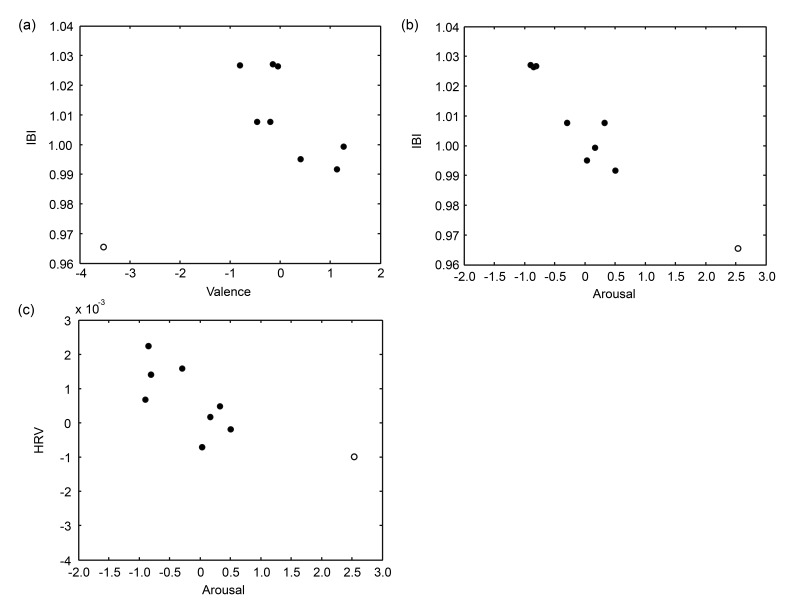
Figure 5.
The data plots displaying the significant correlations between (a) valence and IBI, (b) arousal and IBI, and (c) arousal and HRV. Solid circles represent the eight regular drinks, and the open circle represents the vinegar solution. Note that correlation analysis were performed on the eight regular drinks only.

