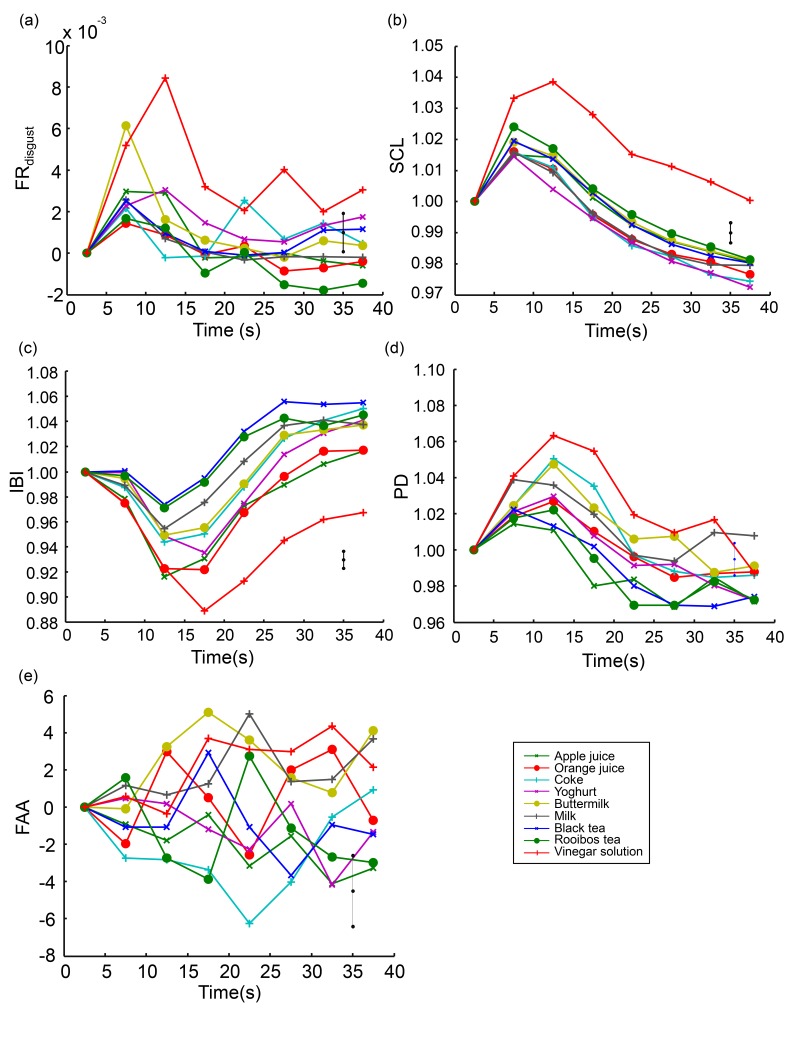
Figure 6.
The continuous behavioral measure FRdisgust (a) and the physiological measures SCL (b), IBI (c), PD (d), and FAA (e) plotted over time from the time that the name of the drink appeared (t = 0 s) to just before the rating scales appeared (t = 40 s), averaged across participants and separately for each drink.

