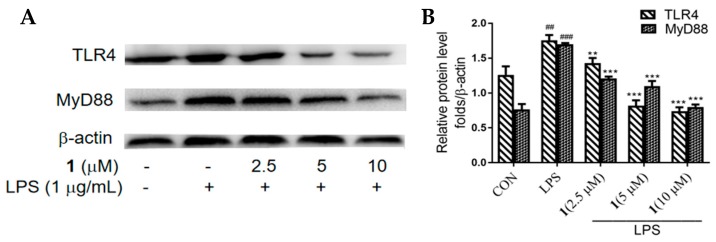
Figure 3.
Effect of 1 on TLR4 and MyD88 expression in LPS-induced RAW 264.7 macrophages, as determined by Western blotting. Cells were incubated with various concentrations of 1 (2.5, 5 or 10 μM) and LPS (1 μg/mL) for 24 h. β-actin was used as the internal control. (A) Results are presented as representative of three independent experiments and summarized in the bar graphs. (B) Data are presented as means ± SD of three independent experiments. ## p < 0.01, ### p < 0.005 vs. control cells. ** p < 0.01, *** p < 0.005 vs. LPS-induced cells.

