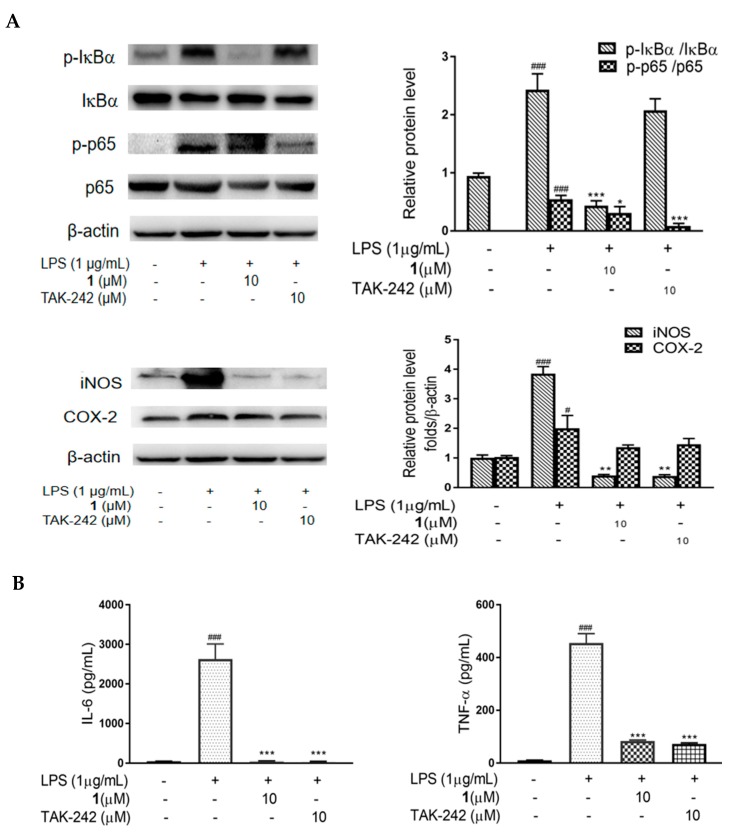
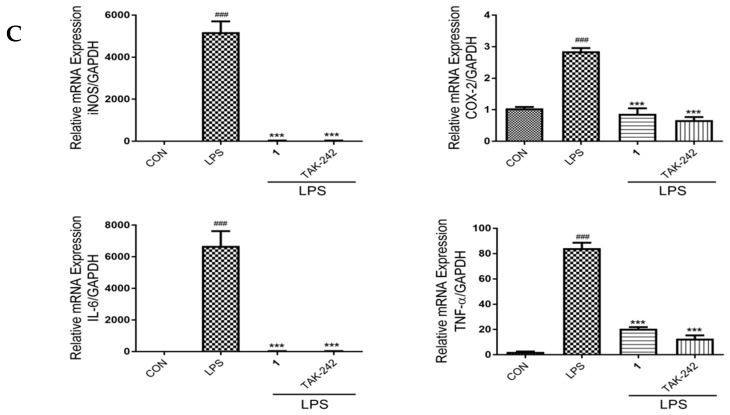
Figure 6.
Effect of 1 on phosphorylation of NF-κB subunits, and the expression of pro-inflammatory cytokines in LPS-induced RAW 264.7 macrophages. Cells were incubated with 1 (10 μM) or TAK-242 (10 μM) and LPS (1 μg/mL) for 24 h. (A) Western blotting was performed to detect the expression of IκBα, p-IκBα, p65, p-p65, iNOS and COX-2. β-Actin served as the internal control. Quantification of immunoreactive protein bands is shown via bar graphs. (B) ELISA was determined to measure the production of IL-6 and TNF-α. (C) RT-PCR was performed to detect the mRNA levels of iNOS, COX-2, IL-6 and TNF-α. GAPDH was used as the internal control. Values are representative of three independent experiments. # p < 0.05, ### p < 0.005 vs. control cells. * p < 0.05, ** p < 0.01, *** p < 0.005 vs. LPS-induced cells.


