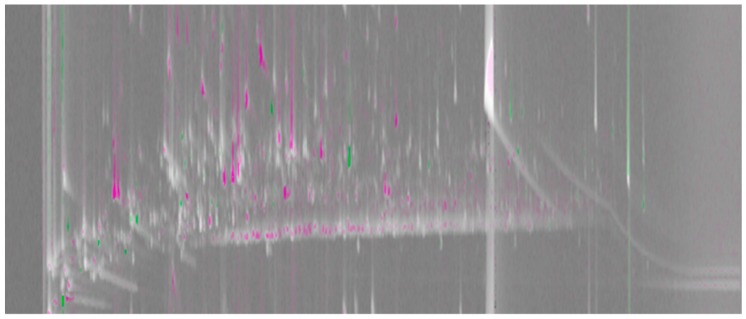
Figure 1.
A comparative visualization between composite GC×GC/MS chromatograms of the high (reference image) and low (analyzed image) elevation teas. The magenta and green peak regions show the areas in the chromatogram where relative distribution of common analytes is higher in the high and low elevation teas, respectively. Light grey peak regions correspond to analytes with similar percentage response in the two chromatograms.

