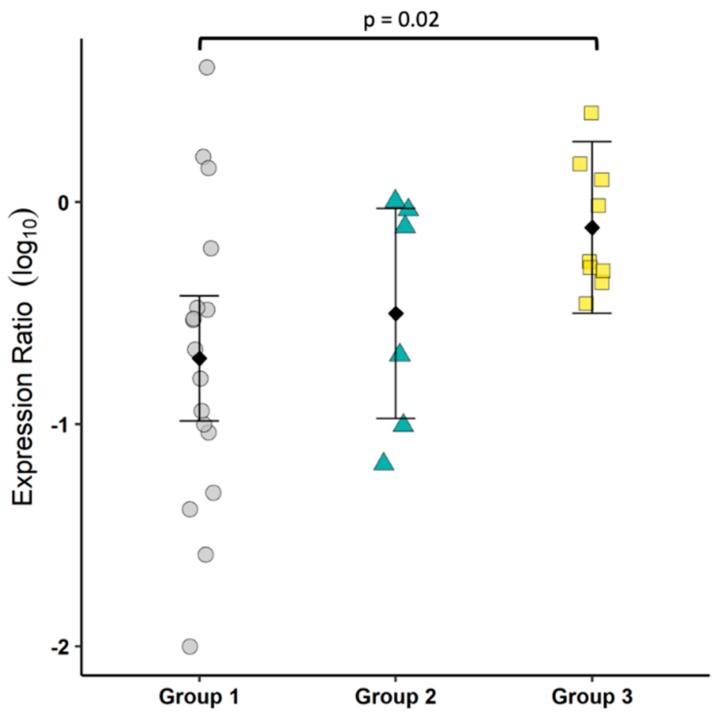
Figure 4.
FECV infection induced an inflammatory bias, as indicated by IL17:FoxP3. The ratio of IL17 to FoxP3 transcripts was determined by real-time RT-PCR. Each symbol represents a single cat. Bars show the mean and 95% confidence interval. Linear models were used to compare group means, and p values are shown when ≤0.05. Prior to log transformation, 0.01 was added to the expression ratio.

