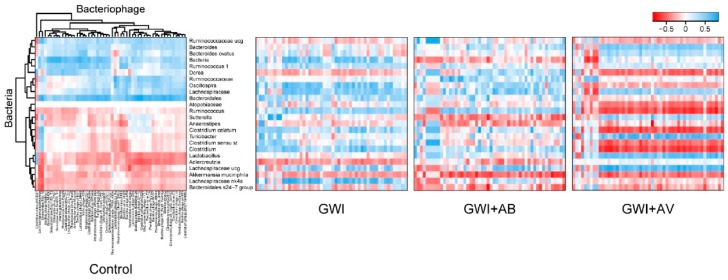
Figure 3.
GWI and intervention alterations in bacteria-bacteriophage interactions. Heatmap of Pearson correlations between bacteria (rows) and bacteriophages (columns) are shown. Clustering was performed on the control group (left), and the same clustering order maintained in the correlation plots of Gulf War illness (GWI), GW chemicals and antibiotics (GWI+AB), and GW chemical and antiviral (Ribavirin) (GWI+AV) groups (right).

