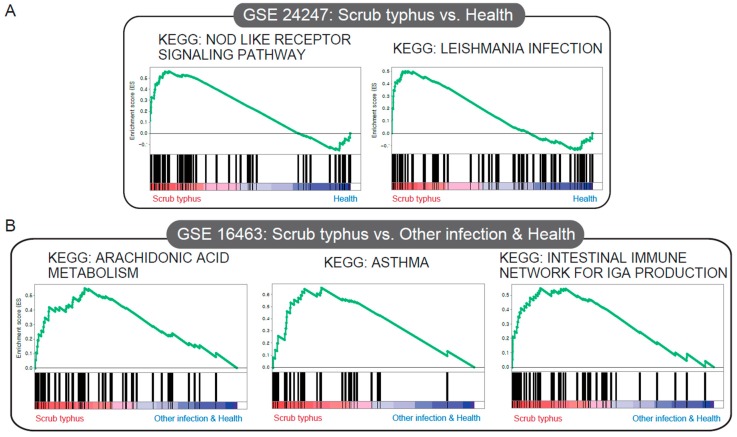
Figure 4.
Gene expression data analyzed using gene set enrichment analysis (GSEA) to extract biological information. In each thumbnail, the green curve represents the evolution of the density of the genes identified in the RNA-Seq data. GSEA calculates these by walking down the ranked-ordered list of genes, increasing a running-sum statistic when a gene is in the gene set, and decreasing it when it is not. (A) KEGG JAK–STAT signaling pathway, KEGG NOD-like receptor signaling pathway, compared to the healthy group (GSE24247). (B) KEGG arachidonic acid metabolism, KEGG asthma, and KEGG intestinal immune network for IGA production, compared to other infection (GSE16463).

