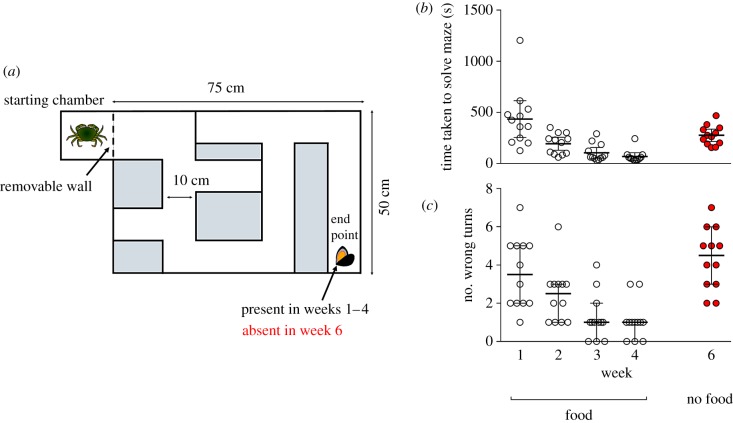
Figure 1.
(a) Scale schematic of the experimental maze showing an individual C. maenas present in the starting chamber and a single, crushed M. edulis (present in weeks 1–4, absent in week 6) at the endpoint. (b) Time taken to reach the endpoint of the maze (latency; s) by C. maenas individuals in weeks 1–6. Lines = mean ± 95% confidence intervals (CIs), n = 12. (c) The number of wrong turns taken by individual C. maenas in weeks 1–6. Lines = median ± 95% CIs, n = 12. Carcinus maenas clipart courtesy of Tanya L. Rogers. (Online version in colour.)

