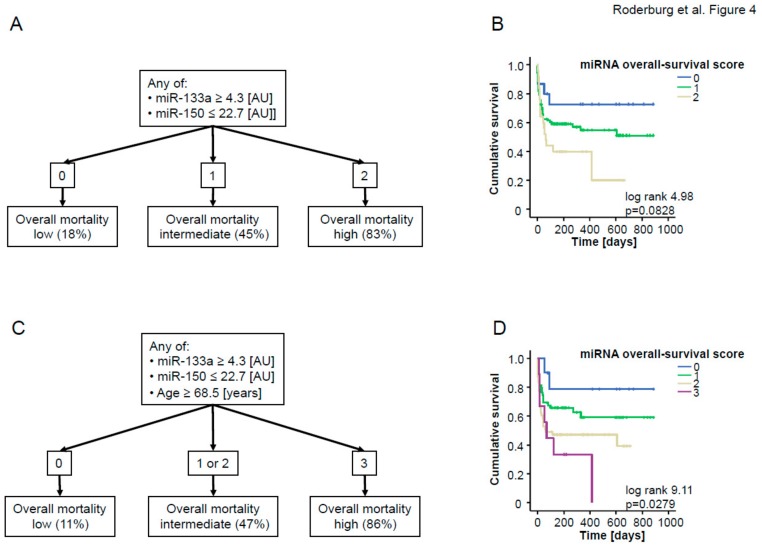
Figure 4.
(A) The individual “overall survival score” was calculated as described in the text. In brief, patients with higher (in case of miR-133a) or lower (in case of miR-150) levels than the respective cut-off were given one point for each individual dysregulated miRNA. All points were added to an “overall survival score”, (B) Kaplan–Meier curve analysis of ICU patients demonstrates that patients with higher “overall survival scores” had an increased overall mortality compared to other patients; p-values are given in the figure. (C) Age was included into the score. Patients older than 68.5 years received one additional point. (D) Kaplan–Meier curve analysis of ICU patients demonstrates that patients with higher scores had an increased overall mortality compared to other patients; p-values are given in the figure.

