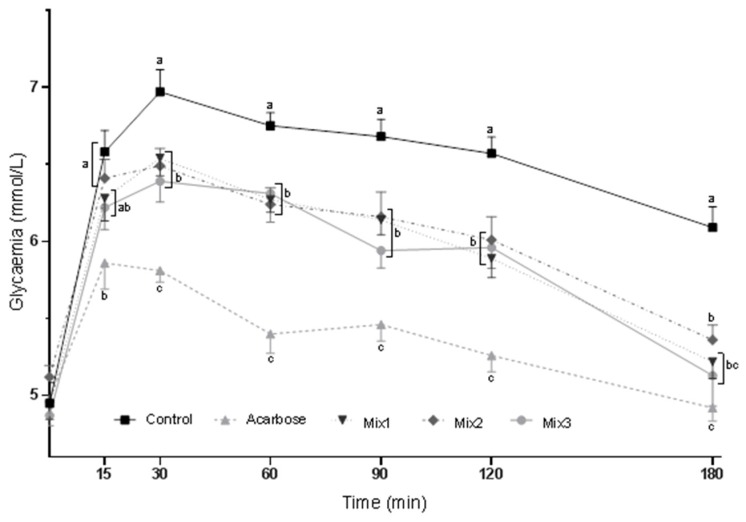
Figure 2.
Blood glucose curves for the oral starch tolerance test (StTT) in rats gavaged with acarbose or composed mixtures. Values are expressed as the mean ± SEM (n = 12). Mean values with differing letters within a time period (a, b, c) are significantly different at p < 0.05 in a post hoc test. BW, body weight. Composition and doses (mg/kg BW): Mix1—mulberry leaf extract (120 mg) + kidney bean extract (100 mg) + coffee bean extract (20 mg); Mix2—mulberry leaf extract (120 mg) + coffee bean extract (20 mg) + arabinose (25 mg); Mix3—mulberry leaf extract (120 mg) + kidney bean extract (100 mg) + coffee bean extract (20 mg) + arabinose (25 mg).

