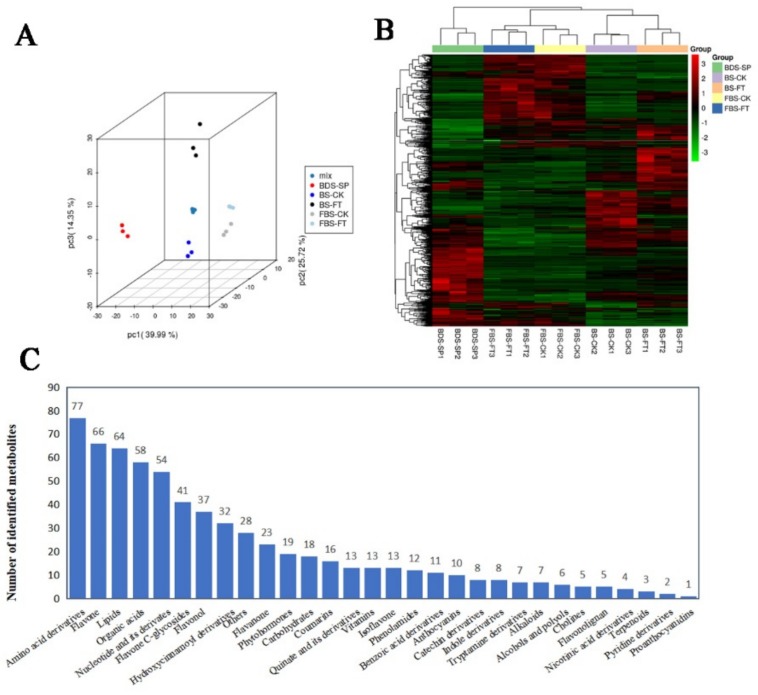
Figure 2.
Quality control analysis and metabolite identification of all samples. (A) Score plot of principal components analysis for all samples based on mass spectrometry data. Mix refers to the mixing of all samples as a quality control sample. SP refers to the starting point of flooding; CK refers to the control group; FT refers to the flooding treatment group. (B) Heat map of all samples by hierarchical cluster analysis. (C) Classes and quantity of identified metabolites.

