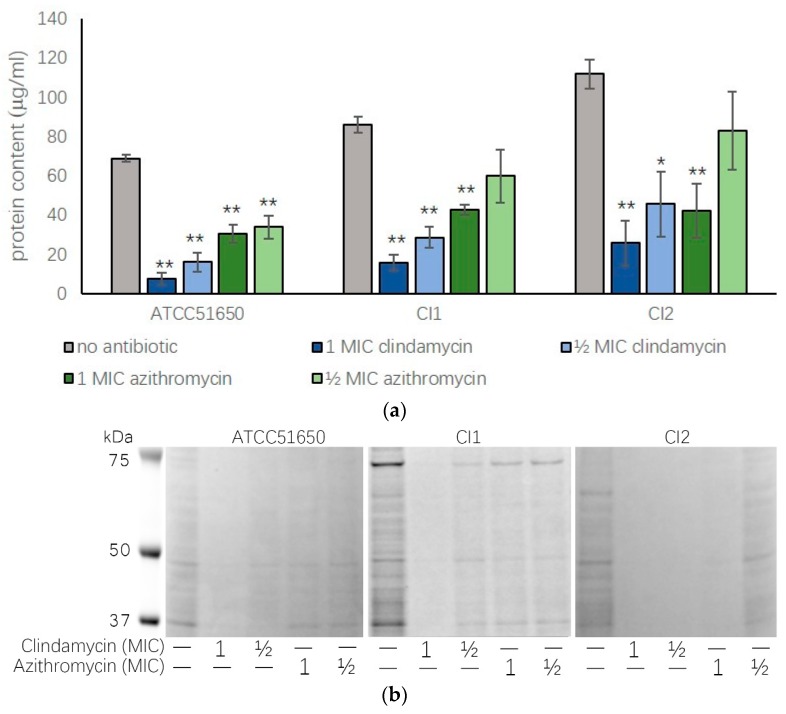
Figure 3.
Biofilm protein content after ½ MIC and 1 MIC clindamycin and azithromycin treatment. (a) Protein content measured by NanoOrange (μg/mL) or (b) gel electrophoresis of 48-h biofilms of ATCC 51650, CI1 or CI2 in the absence (no antibiotic, grey bar) or presence of ½ MIC and 1 MIC clindamycin (blue bars) or azithromycin (green bars). (* p < 0.05, ** p < 0.01, one-way ANOVA followed LSD post hoc comparison, n = 3).

