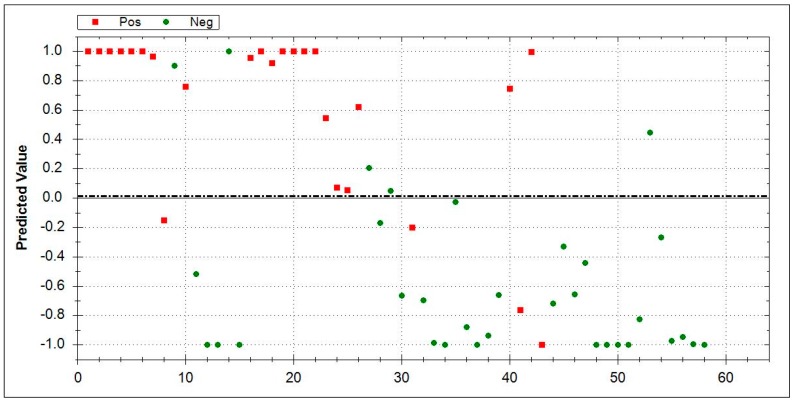
Figure 2.
Direct comparison between CTD-ILD (n = 25, red squares) and HC (n = 33, green dots) by Aeonose®. CTD-ILD area 0–1: Red squares indicate correctly recognized CTD-ILD patients while green dots denote false positive patients. HC area 0–−1: Green dots represent correctly-identified healthy controls, while red squares mark false negative results. Abbreviations: CTD-ILD-connective-tissue diseases- associated ILD, HC- healthy controls.

