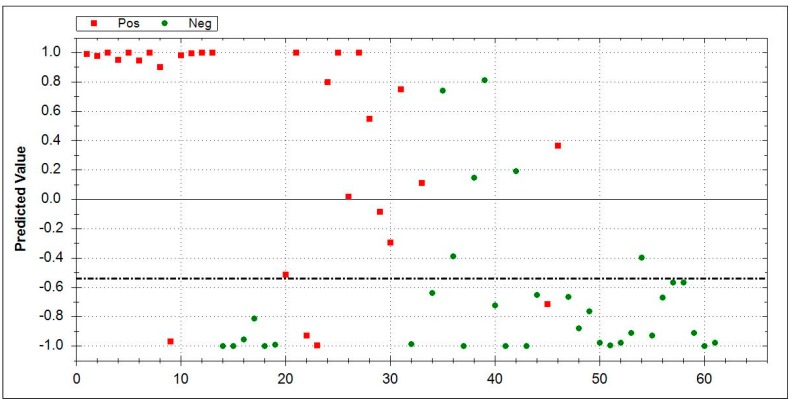
Figure 3.
Direct comparison between COP (n = 28, red squares) vs. HC (n = 33, green dots). COP area 0–1: Red squares indicate correctly recognized COP patients while green dots denote false positive patients. HC area 0–−1: Green dots represent correctly identified healthy controls, while red squares mark false negative results. The dotted line is inserted for values around the threshold where there is doubt about which side it tends to, and, hence, reflects an area of uncertainty. Abbreviations: COP-cryptogenic organizing pneumonia, HC- healthy controls.

