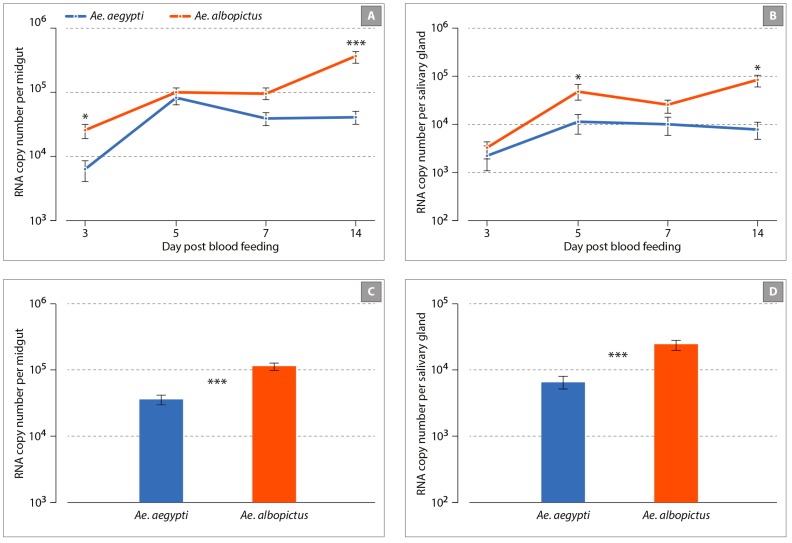
Figure 2.
Kinetics of Mayaro (MAYV) infection of Ae. albopictus and Ae. aegypti mosquitoes. Panels (A,B) represent the number of the viral genome across time in the midgut and salivary glands, respectively. Panels (C,D) represent the mean number of viral genome for all time points. Error bars represent the standard error of the mean and asterisks indicate the significance level for statistical difference between mosquito species: * p < 0.05; *** p < 0.001; non-significant differences were not indicated for clarity.

