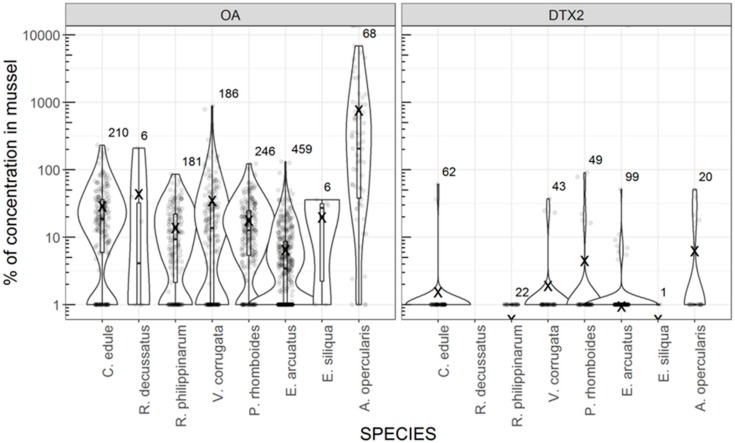
Figure 4.
Violin plots of the percentage of OA and DTX2 in several bivalve species in relation to raft mussels from the same area and the same week. The shape of the “violin” shows the distribution of the observations and the box plot inside is standard: quartiles, and median (box), min and max (whiskers). X indicates the mean after removing 6 observations in which the concentration in raft mussel was 0. The numbers of observations and the individual values (dots) are also shown.

