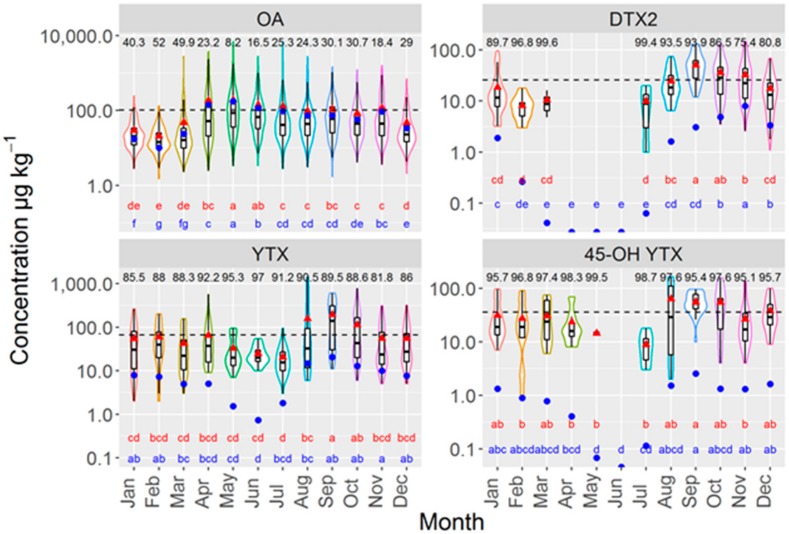
Figure 8.
Violin plots of the concentrations of OA, DTX2, YTX, and 45-OH YTX in several bivalve species (“violin description as in Figure 4), including the means corresponding to all observations (blue circles) and observations over the LOD (red triangles). The numbers in the upper part of each plot are the percentages of observations lower than the LOD, and the letters in the lower part are the corresponding Tukey HSD test groups for all observations (red) and observations over the LOD (blue). The horizontal line represents the average toxin concentration.

