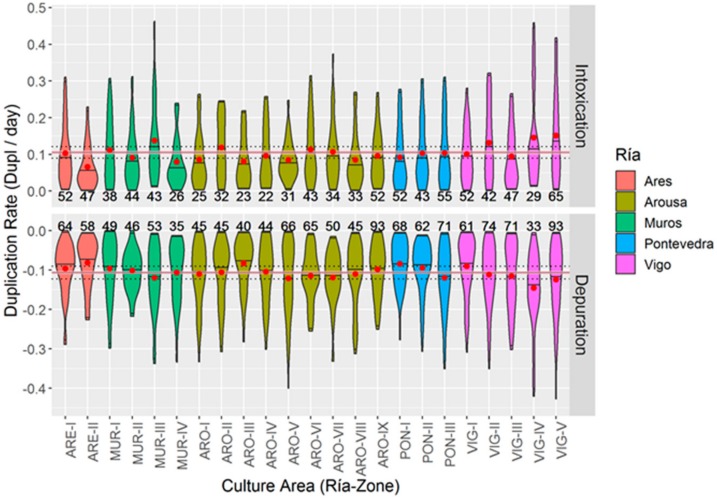
Figure 13.
Violin plots of the duplication rates of OA in the mussel culture areas after removing outliers. Means = red circles, the pink ribbon indicates the overall mean ± 2·SE, and the blue ribbon indicates the overall mean ± 15%. Numbers above and below the “violins” are the actual number of observations.

