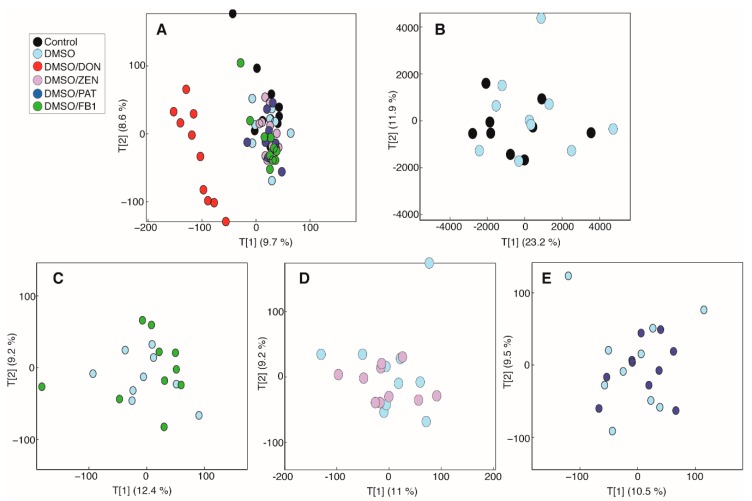
Figure 2.
Principal-components analysis (PCA) models comparing the intracellular metabolic profiles of all cells from the study measured by 1H NMR spectroscopy. (A) Scores plot from the PCA model comparing the intracellular metabolic profiles from all cells (PC1 vs. PC2; R2 = 18.3%). Scores plots from pairwise PCA models comparing (B) control and DMSO-treated cells (PC1 vs. PC2; R2 = 35.1%), and DMSO-treated cells with those treated with (C) 0.5 µg/mL fumonisin B1/DMSO (PC1 vs. PC2; R2 = 21.6%) (FB1), (D) 20 µg/mL zearalenone (ZEN)/DMSO (PC1 vs. PC2; R2 = 20.2%), and (E) 0.1 µg/mL patulin (PA)/DMSO (PC1 vs. PC2; R2 = 20%).

