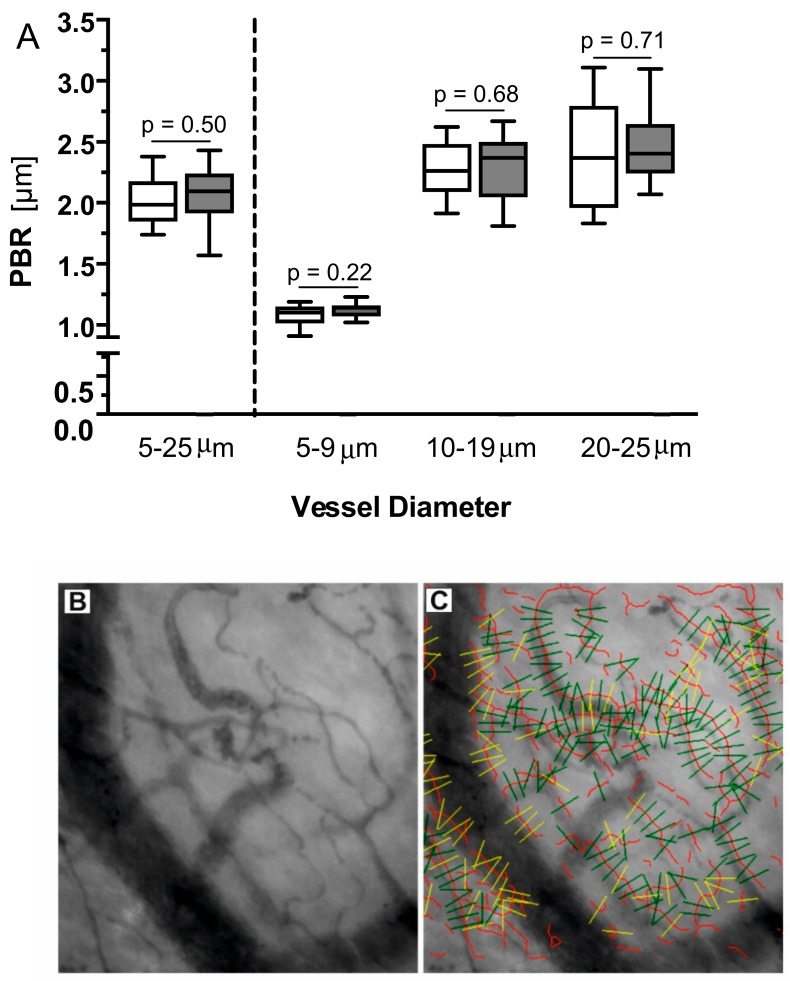
Figure 2.
(A): Boxplots of PBR values of patients with a high C/D ratio (white) and low C/D ratio (grey) based on the different microvascular diameter ranges. No difference was detected between the groups. (B): Representative image of the sublingual mucosa acquired with the SDF camera in a kidney transplant patient. (C): Exemplary picture of a video recording showing the automatic identification of all available micro-vessels with a diameter between 5 to 25 μm. Vascular segments are marked every 10 μm along the assessed microvasculature (red lines) by the GlycoCheck software (green lines: valid segments for further analysis, yellow lines: discarded by quality check).

