Figure 1.
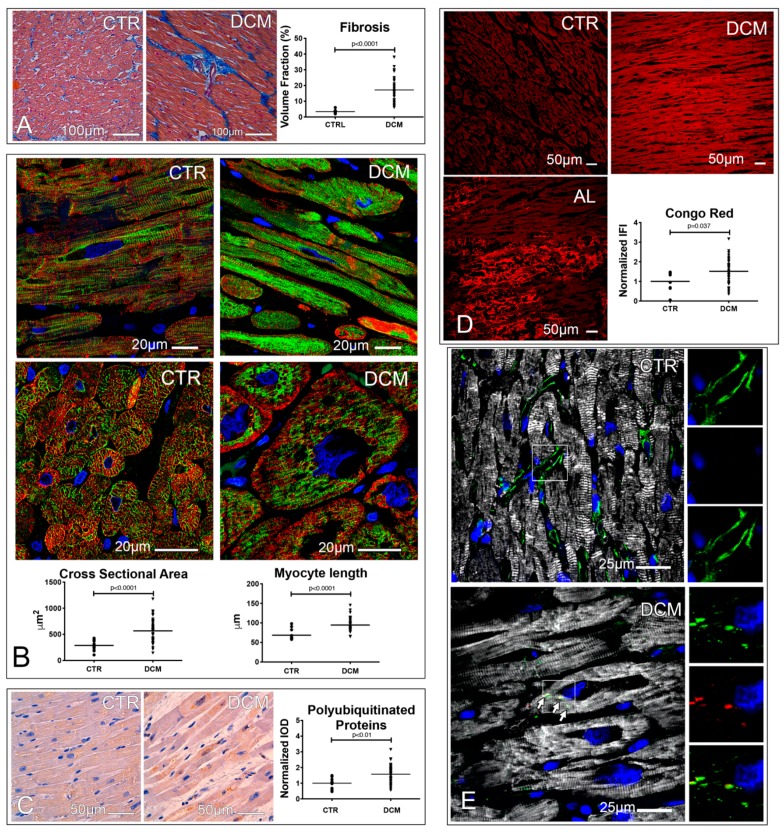
Fibrosis, hypertrophy, and loss of proteostasis characterize the hearts of dilated cardiomyopathy (DCM) patients. (A) Fibrosis. Microimages of trichrome stained control and diseased hearts, showing interstitial and perivascular fibrosis (blue). Dot plots indicate the volume fraction occupied by fibrosis; an unpaired t test was employed. (B) Hypertrophy. Confocal images of cardiac sections showing α-sarcomeric actin (ASA, red) and desmin (green) stained cardiomyocytes. Cardiomyocyte cross-sectional area and length are shown in dot plots; unpaired t test and Mann–Whitney test, respectively, were employed. (C–E) Protein misfolding. Microimages of polyubiquitinated protein labeled cardiac sections (brown). Normalized integrated optical density (IOD) values, obtained dividing individual IOD values by the mean IOD of controls, of the immunohistochemistry staining are shown in dot plots; an unpaired t test was employed (C). Confocal images of Congo red (CR) stained cardiac sections of control, DCM, and AL amyloidosis (AL) patients. CR was excited with a UV laser, while the fluorescence emission range was set at 596–615 nm employing a monochromator. The integrated fluorescence intensity (IFI) values of CR, normalized as IOD, are shown in dot plots; a Mann–Whitney test was employed (D). Confocal images showing the presence of aggresomes. ASA (white) labels cardiomyocytes, while vimentin decorates both interstitial cells and aggresomes (green), these latter being characterized by the co-localization of vimentin and p62SQSTM1 (red). Images of either vimentin, p62SQSTM1, or the combination of the two stainings without ASA are shown in the right portion of each figure (E). Nuclei of fluorescence images are stained in blue by 4′,6-diamidine-2′-phenylindole dihydrochloride (DAPI). A total of 18 controls and 50 DCM hearts were analyzed.

