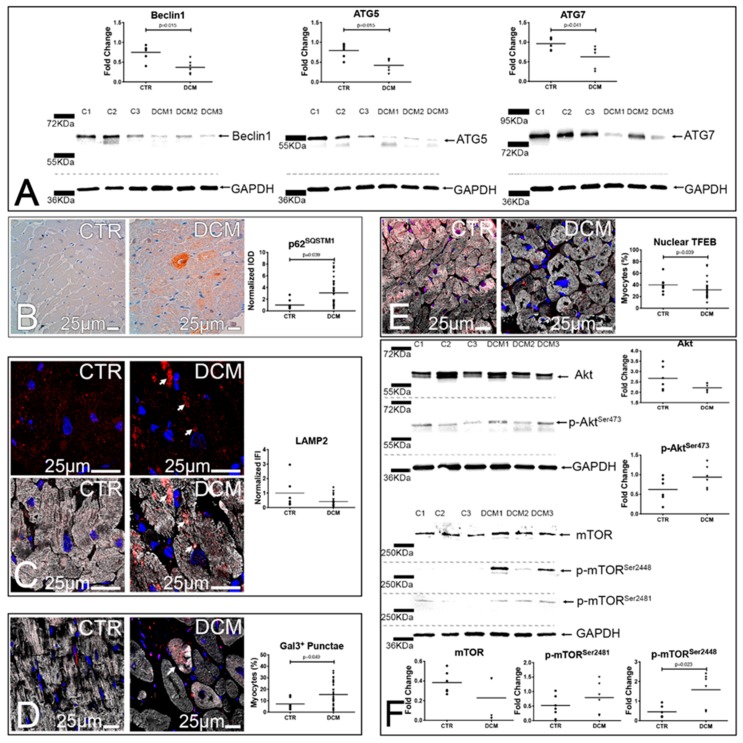
Figure 2.
Defects of the autophagy lysosomal pathway characterize the hearts of DCM patients. (A,B) Autophagy. Western blots (WBs) of whole protein extracts of 3 control hearts and 3 DCM explanted hearts. Blotted proteins were incubated with antibodies against Beclin 1, Atg5, Atg7, and GAPDH. Densitometric analyses of 6 DCM and 6 controls are shown in dot plots; unpaired t tests (Beclin 1 and Atg 5) and Mann–Whitney tests (Atg 7) were employed (A). Microimages of p62SQSTM1-labeled cardiac sections (brown, (B)). Quantitative analysis of p62SQSTM1 staining is shown in dot plots; a Mann–Whitney test was employed. (C–E) Lysosome dysfunction and biogenesis. Confocal images of LAMP2- (red) and ASA-labeled (white) cardiac sections. Arrows point to enlarged lysosomes. Normalized IFI values of LAMP2 staining are shown in dot plots; a Mann–Whitney test was employed (C). Confocal images of Galectin3- (red) and ASA-labeled (white) cardiac sections. Arrow points to a myocyte with Galectin3 punctae. Dot plots display the fraction of cardiomyocytes showing Galectin3 punctae in their cytoplasm; an unpaired t test was employed (D). Confocal images of TFEB- (red) and ASA-stained (white) cardiac sections. Box plots illustrate the fraction of cardiomyocytes showing TFEB nuclear positivity; a Mann–Whitney test was employed (E). In fluorescence images, DAPI labels nuclei (blue). (F) mTOR activation status. WBs of whole protein extracts of 3 control hearts and 3 DCM explanted hearts. Blotted proteins were incubated with antibodies against Akt, p-AktSer473, mTOR, p-mTORSer2448, p-mTORSer2481, and GAPDH. Densitometric analyses of 6 DCM and 6 controls are shown in dot plots; unpaired t tests (Akt, p-AktSer473, p-mTORSer2481 and p-mTORSer2448) and Mann–Whitney tests (mTOR), as appropriate, were employed. For histology, 18 controls and 50 DCM hearts were analyzed.

