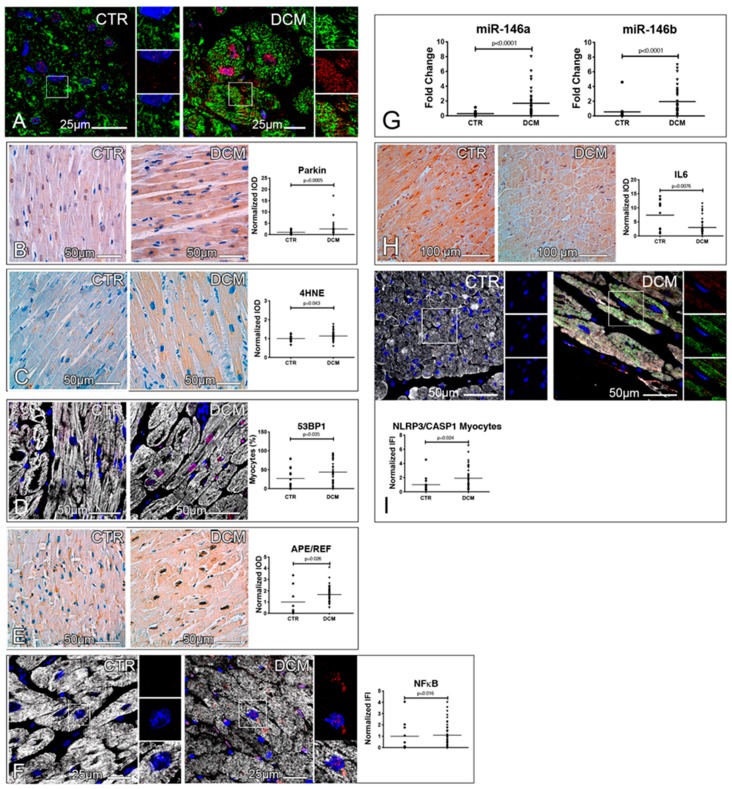
Figure 3.
Evidence of the accumulation of dysfunctional mitochondria, lipoperoxidation products, and activated inflammasomes in explanted hearts. (A,B) Mitochondrial dysfunction. Confocal images of cardiac sections immunostained for mitochondria (green) and Parkin (red). Higher magnifications of the insets are shown, as single channel images of mitochondria and Parkin, in the right portion of each figure (A). Microimages of Parkin immunohistochemistry stainings of cardiac sections (brown). Normalized IOD values of Parkin are shown in dot plots; a Mann–Whitney test was employed (B). (C–E) Oxidative stress and redox signaling. Microimages of 4-hydroxynonenal (4HNE)-labeled cardiac sections (brown). Normalized IOD values of 4HNE are shown in dot plots; an unpaired t test was employed (C). Confocal images of cardiac sections immunostained for 53BP1 (red) and ASA (white). The fraction of cardiomyocytes showing 53BP1 nuclear positivity is shown in dot plots; a Mann–Whitney test was employed (D). APE/REF immunohistochemistry staining of cardiac sections (brown). Results of the quantitative assessment of the nuclear expression of APE/REF are shown in the right panel as normalized IOD; a Mann–Whitney test was employed (E). (F–I) Inflammatory pathways. Confocal images of p65 NFκB- (red) and ASA-labeled (white) cardiac sections. Higher magnifications of the insets are shown in the right portion of each figure. Normalized IFI values of NFκB staining are shown in plots (F). Dot plots showing the expression of miR-146a and miR-146b in controls and DCM hearts, as assessed by RT-PCR. Data were normalized employing the 2−ΔΔCt method, using miR-92a as housekeeping gene; Mann–Whitney tests were employed (G). IL6 immunohistochemistry staining of cardiac sections (brown). Normalized IOD values of IL6 staining are shown in dot plots; a Mann–Whitney test was employed (H). Epifluorescence images of NLRP3- (green), caspase1- (red), and ASA-labeled (white) cardiac sections. Higher magnifications of the insets are shown in the right portion of each figure. Normalized IFI values of caspase1 staining colocalized with NLRP3 positivity are shown in dot plots; a Mann–Whitney test was employed (I). In fluorescence images, DAPI-labeled nuclei are shown in blue. A total of 18 controls and 50 DCM hearts were analyzed for histology and RT-PCR experiments.

