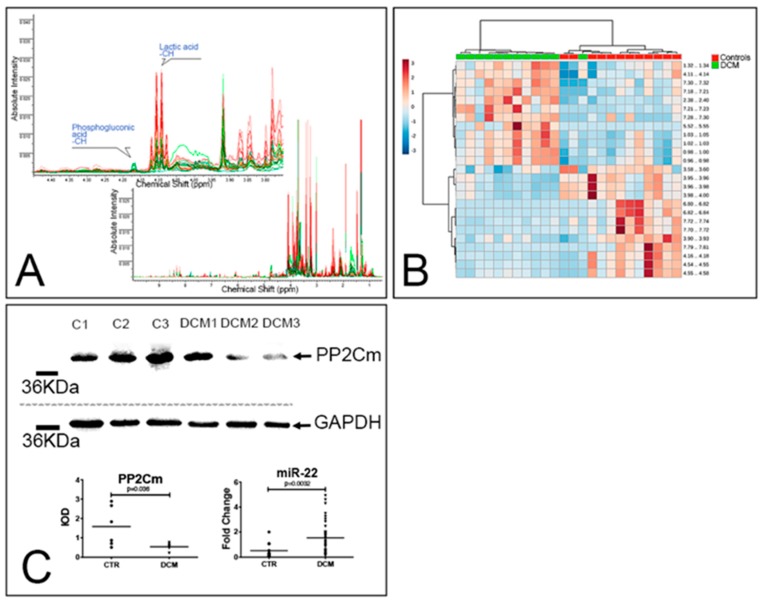
Figure 4.
DCM is associated with alterations of amino acid metabolism. (A,B) Metabolomic analysis. 1D NMR spectra of 12 control (green lines) and 12 DCM hearts (red lines). The full spectra are shown in the bottom panel, while the top panel shows the 3.75–4.45 ppm region and the peaks assigned to lactic acid and 6-phosphogluconic acid (A). Heatmap summarizing the results of the hierarchical clustering analysis generated employing the top 25 features ranked by t tests. Each colored cell on the map corresponds to a concentration value in the data table, with samples in columns and features/compounds in rows (B). (C) WB and real-time PCR analyses. Representative WB of whole-protein extracts of 3 control hearts and 3 DCM explanted hearts. Blotted proteins were incubated with antibodies against PP2Cm and GAPDH. Results of the densitometric analyses (n = 6 controls and 6 DCM) are reported in the bottom-left panel; a Mann–Whitney test was employed. The bottom-right panel summarizes the results of the RT-PCR analysis of miR-22 expression in control (n = 12) and DCM (n = 37) hearts; a Mann–Whitney test was employed. Fold change was computed using miR-92a as a housekeeping gene.

