Figure 5.
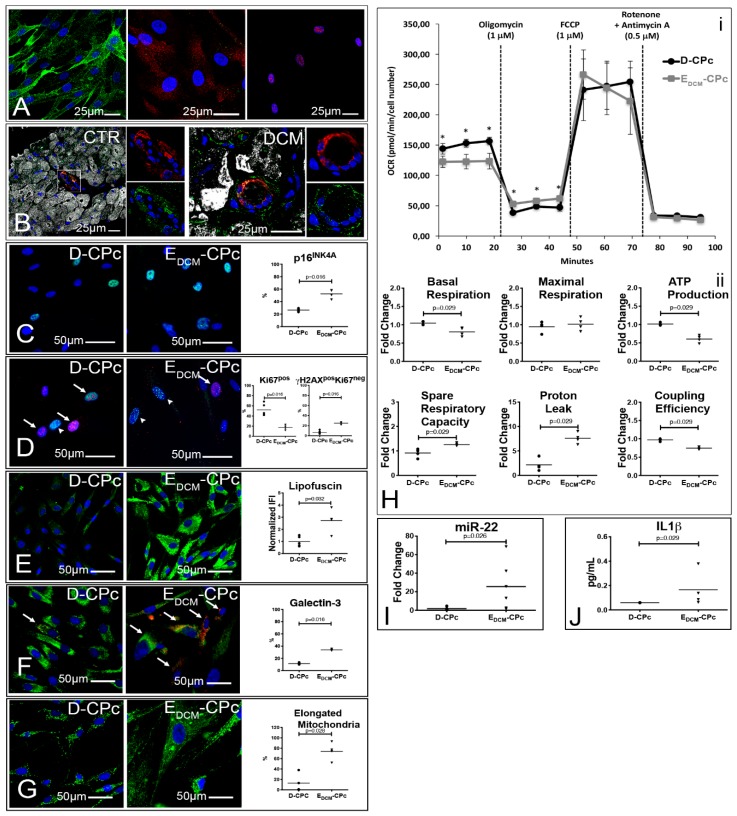
Cardiac pericytes isolated from diseased hearts are senescent and accumulate dysfunctional mitochondria. (A,B) In vitro and in vivo characterizations of CPc. Confocal images of cultured CPc (n = 5 D-CPc and n = 5 EDCM-CPc) stained for NG2 (green, left panel), PDGFRα and PDGFRβ (green and red, central panel), and Tbx18 (red, right panel; (A)). Confocal images showing that mostly PDGFRβ+ cells (green) are localized in and around arterioles and capillaries and coexpress smooth muscle actin (red). ASA is shown in white (B). (C–G) Senescence and ALP dysfunction of EDCM-CPc. Epifluorescence images of CPc isolated from normal (D-CPc; n = 5) and pathologic hearts (EDCM-CPc; n = 4) show positivity to p16INK4A (green, C), γH2A.X (green) and Ki67 (red, D), lipofuscins (green, €), Galectin 3 (red) and LAMP2 (green, (F)), and mitochondria (green, (G)). Nuclei are labeled by DAPI in blue. Dot plots in C–G indicate the results of the quantitative analysis; Mann–Whitney tests were employed. (H) Profiles of mitochondria bioenergetics measurements. Plots in (i) display average (±S.D.) OCR of 4 D- and 4 EDCM-CPc, measured at baseline and after the addition of the stressors oligomycin, FCCP, rotenone, and antimycin A. Time and type of stressor administration are indicated by dashed lines. Parameters quantified from the experiment were normalized employing the respective average value of D-CPc and are shown in dot plots in (ii); Mann–Whitney tests were employed. (I,J) Real-time PCR and ELISA analyses of CPc. Results of RT-PCR analysis of miR22 expression in 6 D- and 6 EDCM-CPc (I). IL1β concentration in CPc culture supernatant (J); Mann–Whitney tests were employed.

