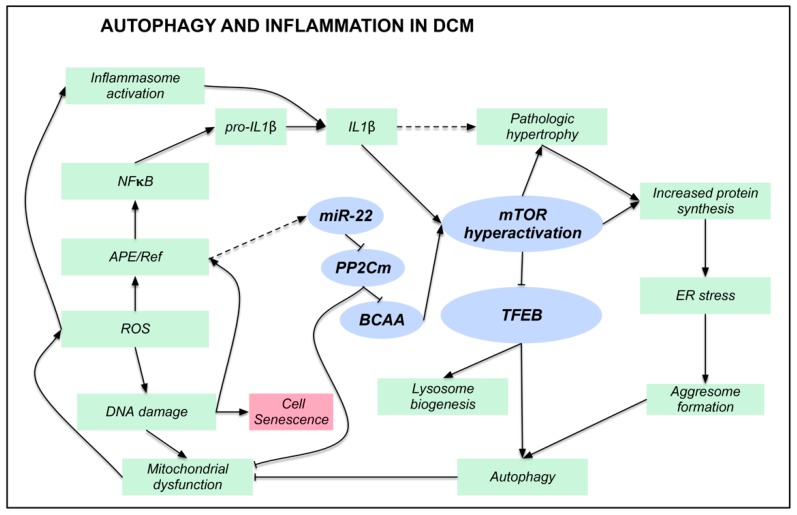
Figure 7.
Autophagy and inflammation in DCM. Illustration summarizing the main findings described in human DCM samples. Blue ellipses indicate the key actors of this process. Dashed arrows indicate correlative or literature findings. Arrows with blunt ends indicate inhibition, while pointed arrows indicate activation.

