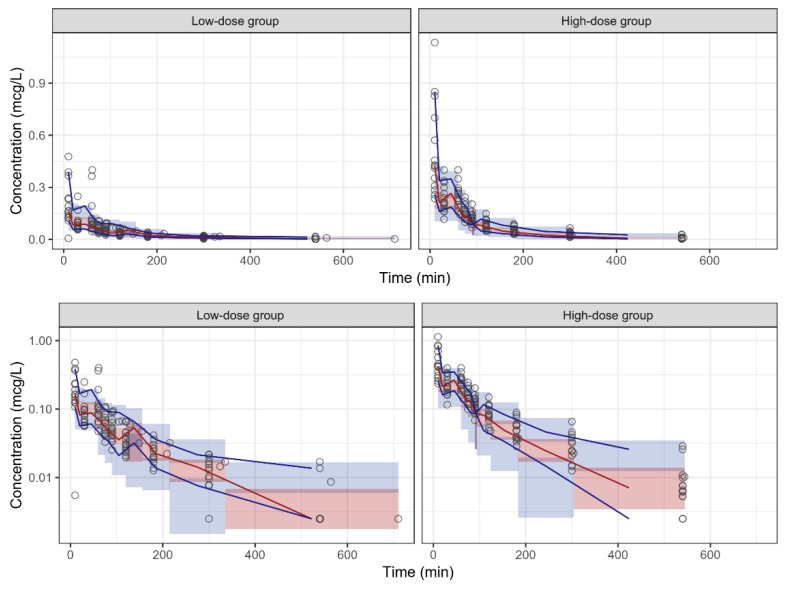
Figure 3.
The linear (upper) and log-linear (lower) plots of the visual predictive check of the population pharmacokinetic model for dexmedetomidine by dose group. Circles = observed data; red solid line = median observed data; blue solid lines = 5th and 95th percentiles of the observed data; red area = 95% confidence intervals (CI) for the median simulated data; blue area = 95% CI for the 5th and 95th percentiles of the simulated data.

