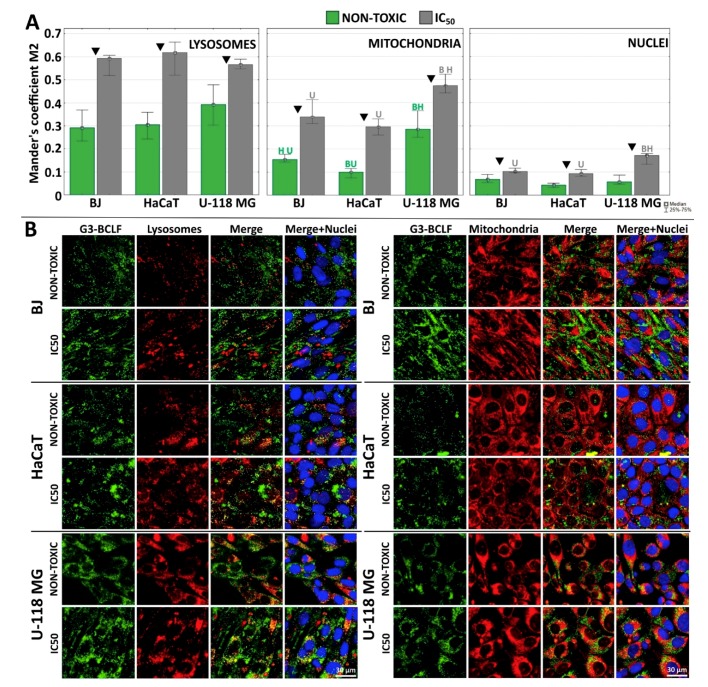
Figure 4.
(A) Localization of G3-BCLF in lysosomes, mitochondria and nuclei of BJ, HaCaT and U-118 MG cells after 24 h incubation at low, non-toxic (0.1 µM) and equal to IC50 concentrations. Results are medians of twelve images measurement from each experimental group and expressed as Mander’s coefficient. The whiskers are lower (25%) and upper (75%) quartile ranges. Letters indicate significant differences between cell lines (each letter indicate cell line), P < 0.05; Kruskal-Wallis test. ▼ P < 0.05; Mann–Whitney U-test (non-toxic against IC50 concentration). (B) Confocal images presenting colocalization of G3-BCLF within lysosomes, mitochondria and nuclei in investigated cell lines. Green signal: G3-BCLF, red: lysosomes (left panel) or mitochondria (right panel), blue: DAPI stained nuclei, yellow: overlapping signal from G3-BCLF and lysosomes or mitochondria. Scale bar equal 30 µm.

