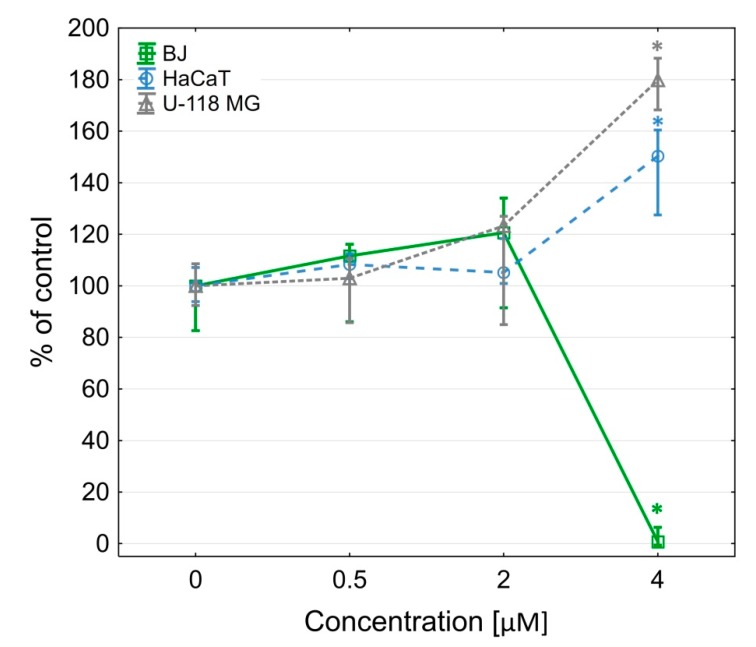
Figure 5.
Intracellular ATP level in BJ, HaCaT and U-118 MG cells after 24 h treatment with G3-BCL. Results are presented as median of triplicates from three independent experiments and expressed as % of non-treated controls. The whiskers are lower (25%) and upper (75%) quartile ranges. * P < 0.05 (Kruskal–Wallis test).

