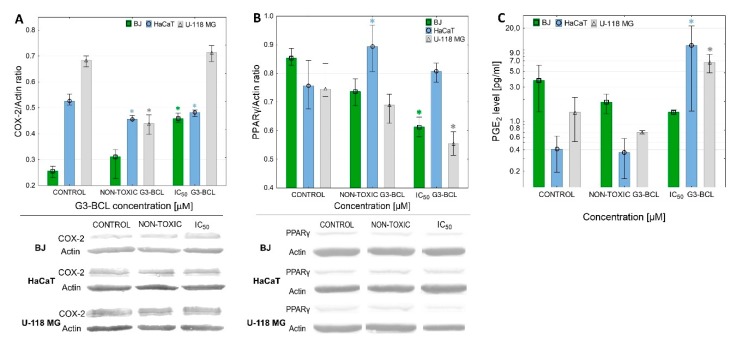
Figure 8.
Effect of G3-BCL on expression of COX-2 protein (A), PPARγ (B) and PGE2 production (C) in BJ, HaCaT and U-118 MG cells after 24 h treatment with non-toxic (0.5 µM) or IC50 concentrations (estimated with XTT assay). Levels of COX-2 protein were calculated against β-actin and expressed as the percent of the control. Squares indicates medians and whiskers corresponding to the lower (25%) and upper (75%) quartile ranges. * P < 0.05 significant difference against control (Kruskal–Wallis test).

