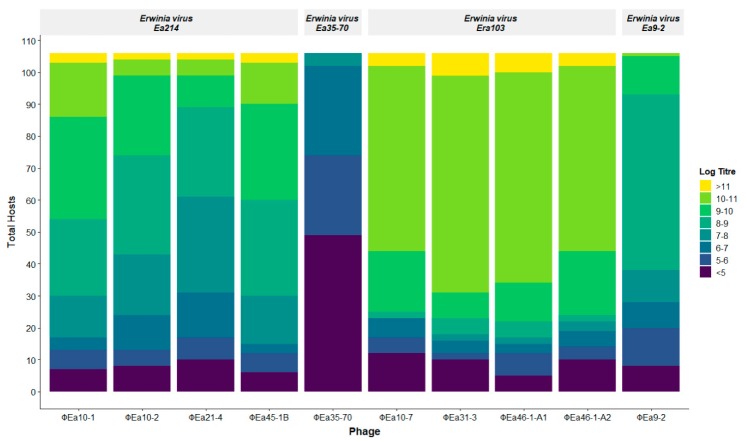
Figure 2.
Distribution of phage productivity in all 106 Erwinia sp. hosts. Each colour represents the final genomic phage titre (genomes/mL) produced by a host, and the height of that colour is the number of hosts on which each phage achieves that titre. The log of the genomic titre is used for visual simplicity.

