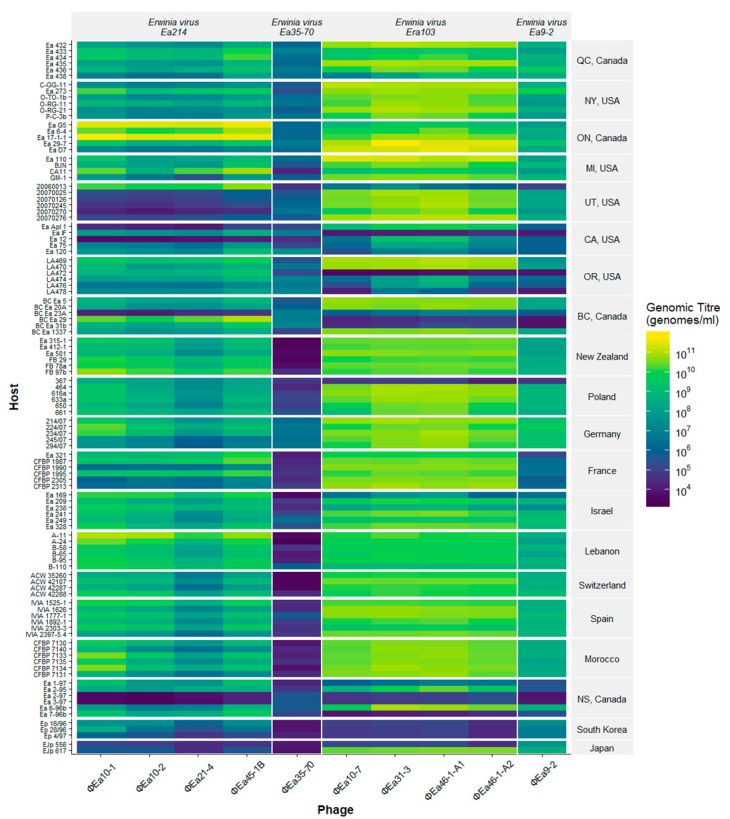
Figure 3.

Heat map of the final genomic titre of each phage produced after growth on all hosts. The growth of the phage is indicated by colour, where yellow is maximal total final genomic titre (genomes/mL) and blue shows no growth beyond starting genomic titre of 104 genomes/mL after 8 hr incubation. The hosts are indicated on the left y-axis and are separated by their location of isolation on the right y-axis. The phages are indicated along the x-axis and grouped by species at the top.
